No. 43 – Febryary 23,
2000 |
 |
1. Editorial: Trading in souls |
|
|
Nikolai Gogol's masterpiece Dead Souls (1842) was about a Russian social climber trading in souls. The value of land was not based on acres or harvest, but on the number of people working on it – called "souls". A peculiar character in Gogol's book, Pavel Chichikov, buys dead souls to enhance his status as a land owner.
Something similar is happening today, with politicians counting voters that they think they "own" – and companies counting customers. Especially on the internet. There are actually cases of online services counting departed souls. These people probably aren't dead; but they could be, as far as the soul traders know, because they are no longer using their systems. That, however, is only a small part of the problem. Even if the soul count is up-to-date and correct it's quite doubtful that anyone owns the property that is being traded – or that it's worth the money being paid.
A major provider in Italy came under scrutiny for collecting and selling information about his customers without their knowledge or approval. His behavior was condemned by both the authorities involved (protection of data privacy and fair trade) setting a standard for future judgment on such subjects. Interestingly, the accused pleaded that they had been unable to generate useful customer profiles or to sell any of the data. The question is, if that is so, why did they try?
Soul trading exists, though it's seldom publicly admitted. Per-head prices are being paid for "traffic transfer". Investors look for simple yardsticks that they can standardize and compare: thus headcount can be a substantial factor in defining the financial value of a company. Advertising reps claim that they can charge a high per-contact price because they have "profiles" of people's attitudes and behavior. There is a remarkable lack of accountability in all this; no reliable record of actual business results.
A lot of this data trading and number crunching is the result of a search for simplistic solutions to avoid the effort of developing genuine service and customer care; and an attempt to bend the new economy to the familiar standards of old economy criteria. It doesn't seem to work; but even if it did it would be dangerous. Not only because of the legal risks and the irritation of customers who don't enjoy the idea of being manipulated. What's even more important is that these apparently simple "solutions" distract companies from the real needs and opportunities of the network economy.
In this new environment we don't need old and clumsy tools such as traditional segmentation. Customer empowerment is not a romantic theory. It's a hard fact. There is considerable practical value in concepts such as permission marketing or the caring economy or the cultivation of the internet. What we need is some real farming, not slave trading.
back to top
|
 |
2. Confusopolies (Scott Adams) |
|
|
Many a true word is spoke in jest, said Shakespeare. Scott Adams is famous for the Dilbert comic strips, published by 1900 newspapers around the world. He has also written books such as The Dilbert Principle, The Joy of Work, Dogbert's management handbook, which are quite funny but make some serious points about why things don't work in business.
In 1998 he published The Dilbert Future – Thriving on Business Stupidity in the 21st Century in which he discusses a marketing style that he calls a "confusopoly". Scott Adams explains that "barriers to entry", which protected successful companies from competition, are getting weaker. As a result, groups of companies with similar products set up "confusopolies", to intentionally confuse customers so the can't tell who has the lowest price or the best value. This is happening especially in some categories, such as telephone services, insurance, banking and other financial services.
Facts are proving him right. A pretty obvious example of a confusopoly is the price an tariff mess that followed the opening of the telephone (and therefore internet) market in my country. The jungle of prices and price promotions is to tangled that people have no idea of how much they are paying and are totally confused about which offer suits their needs.
The same sort of thing has been happening for a long time, and is continuing to happen, in information technology and in everything related to the internet or e-business. Often leading people and companies to pay high prices for technologies or services that don't fit their needs.
How long will this last? Nobody knows. There is a natural alliance of the media confusopoly and its business equivalents; this is likely to keep the mess going much longer than it should. But sooner or later customers will begin to see though the smoke screens - or aggressive competitors will make their offers clear and to the point. I hope it isn't just wishful thinking to believe that, over time, the confusopoly bashers will be the winners.
back to top
|
 |
3. E-business as seen by Amazon (Jeff Bezos) |
|
|
Of many interviews with Jeff Bezos, founder and chairman of Amazon, the best I have read was by Donald Sheff. It was published in the in the February 2000 issue of Playboy magazine. It's long, and most of it is quite interesting; here I am quoting only a few of the most relevant remarks.
Bezos said that he loves books, since he was a child. But that is not the reason why he chose books as the first thing he would try so sell online. A that time (1995) there wasn't much trading on the internet. He was starting practically from scratch, inventing a new way of doing business.
I looked at popular products in mail order and saw that books were way down the list. Why? If you were to print a catalog with all the available books, it would be larger than 50 New York City phone books. You are not going to mail that around 12 times a year. Yet there was a technology that could put the whole catalog in the hands of customers. The largest physical superstores have about 170,000 titles: Amazon.com, even when we launched, had over a million. Today we have over 18 million items, including toys and electronics and out-of-print books and on and on. So the notion of infinite shelf space became key. I decided I could create true value for customers.
In the beginning, Bezos explained, they were handling orders manually and personally packaging the books. To be able do work on a small scale they had to look for some smart solutions.
We thought we would sell a book a day for a long time. But the wholesalers have a ten-book minimum. I tried to persuade them to waive the ten-book minimum, but they said no, it was too much work to send out less than ten books. But we found a loophole. Their systems were programmed in such a way that you didn't have to receive ten books, you only had to order ten books. So we found an obscure book about lichens that they had in their system but was out of stock. We began ordering the one book we wanted and nine copies of the lichen book. They would ship out the book we needed and a note that said, "Sorry, but we're out of the lichen book." One of these days we're going to get all those lichen books dumped onto our front lawn.
About the value of Amazon on the stock market, Bezos confirmed in this interview what he had said on several other occasions.
The stock of internet companies in general and Amazon.com in particular are incredibly volatile. I encourage people here to spend no time thinking about the short-term stock price. If our stock goes up 30 percent in a month, there's the danger that you'll start to feel 30 percent smarter. That kind of arrogance can lead to the downfall of companies. The volatility works in both directions. When the stock goes down 30 percent, you're going to have to feel 30 percent dumber. That won't feel good. So in general, it's better not to think about it.
Donald Sheff asked: «Is it realistic to ask your employees to ignore the stock price when a major part of their benefits are options?»
It is realistic to ask. I'd rather have them focused on value. Options are a long-term deal. Especially with the web, it is way too easy to check stock prices every minute and it is a complete waste of time. Related to this, I think it's unfortunate that so many people have taken up day trading. In a bull market, it is easy to convince yourself that you are smart. But it's just gambling. Most of those people are going to lose a lot of money over time.
About brand loyalty, this is the opinion of Jeff Bezos – the owner of the biggest worldwide brand in e-commerce.
The companies that rely on brand loyalty are insane. Customers will be loyal to you because you don't take them up on it. It is one of those paradoxes. There is no resting on your laurels. If you assume anything, you are doing a disservice to your customers and they shouldn't be loyal to you. Our customers are loyal to us right up until the second that somebody else offers them better service. We live or die based on the customer experience. Here's the thing: Online, the balance of power shifts away from the company and goes toward the customer. Our secret is that we have not been competitor obsessed. We have been customer obsessed, while our competitors have been Amazon.com obsessed.
I have been "loyal" to Amazon for years. I am pleased that this is their attitude. If it wasn't, or it changed, they could lose me – as any other of their 12 million customers.
back to top
|
 |
4. A car and a bike |
|
|
Last year, at the end of August, Fiat launched an online offer for one of its models: the Barchetta. Early this year it was reported that they had sold four cars. That was generally perceived as a catastrophe, but comments from the carmaker's management showed no disappointment. Roberto Tiby, a spokesman for the sales department, commented: «we at Fiat are very satisfied of the experience we have gained (it was our objective) that helps us to develop other projects (less experimental and more oriented to business) which will become visible in a few months' time». That's quite believable. It was obvious from the beginning that the Barchetta offer was an experiment, a learning tool; not a sales drive.
The case of Ducati is quite different. In January they launched a "limited series" motorcycle, the MH900. A month later they announced that the fist year's production was sold out. Results were above their expectations. It was reported later that this episode is encouraging them to develop other projects online. This is not a case of full-scale online selling: orders are placed online but delivery and technical support go through the traditional channels and dealer networks. Ducati stated that 38 percent of orders came from Japan, 30 percent from North America and 30 percent from Europe. Only 2 percent from their home market, Italy - so this is 98 percent export. They sold 1260 bikes, for a total of 19 million dollars. They were obviously appealing to a worldwide community of bike enthusiasts, particularly devoted to the Ducati brand. A remarkable success, though in a restricted environment: one more proof of the fact that good results on the net are based more often on relatively small, clearly defined markets than on vast but vague appeals to "millions" of people.
back to top
|
 |
5. Numbers worldwide |
|
|
A new hostcount report, for the second half of last year, was published by the Internet Software Consortium in February. This table summarizes global growth from 1995 to 1999.
| |
Number
of hosts |
% growth |
| in 6 months |
in 12 months |
| January 1995 * |
5,846,000 |
51.1 |
118.9 |
| July 1995 * |
8,200,000 |
40.3 |
106.8 |
| July 1996 * |
16,729,000 |
16.6 |
104.0 |
| January 1997 * |
21,819,000 |
30.4 |
52.0 |
| July 1997 * |
26,053,000 |
19.4 |
55.7 |
| January 1998 |
29,670,000 |
13.9 |
36.0 |
| July 1998 |
36,739,000 |
23.8 |
41.0 |
| January 1999 |
43,230,000 |
17.7 |
45.7 |
| July 1999 |
56,218,000 |
30.0 |
53.0 |
| January 2000 |
72,398,000 |
28.8 |
67.5 |
| * The survey criteria changed starting January 1998. Data for 1995-1997 are "weighted" to adjust the new survey data to the old. Percentages in 1995 relating to 1994 are based on the "old" survey. |
With larger quantities, growth percentages declined until 1997; but now they seem to be increasing. The next table covers 37 countries (of 240) with over 50,000 internet hosts.
| |
No. of hosts
December 1999 |
% change |
% of
total |
Per 1000
inhab. |
| in 6 months |
in 12 months |
| United States |
53,167,358 |
+ 29.8 |
+ 74.4 |
73.4 |
187.3 |
| Japan |
2,636,541 |
+ 27.2 |
+ 56.2 |
3.6 | 21.0 |
| United Kingdom |
1,901,834 |
+ 18.9 |
+ 33.6 |
2.6 | 32.7 |
| Germany |
1,702,466 |
+ 19.3 |
+ 29.3 |
2.4 | 20.7 |
| Canada |
1,669,664 |
+ 29.0 |
+ 49.2 |
2.4 | 55.8 |
| Australia |
1,090,468 |
+ 20.1 |
+ 37.6 |
2.2 | 59.6 |
| Netherlands |
820,944 |
+ 28.8 |
+ 45.5 |
1.2 | 52.3 |
| France |
779,879 |
+ 19.3 |
+ 59.8 |
1.1 | 13.3 |
| Italy |
658,307 |
+ 67.2 |
+ 94.3 |
0.9 | 11.5 |
| Finland |
631,248 |
+ 9.4 |
+ 15.6 |
0.9 | 123.8 |
| Taiwan |
597,036 |
+ 40.7 |
+ 93.4 |
0.9 | 27.5 |
| Sweden |
594,627 |
+ 15.5 |
+ 37.7 |
0.8 | 67.6 |
| Brazil |
446,444 |
+ 43.9 |
+ 107.6 |
0.6 | 2.7 |
| Spain |
415,641 |
+ 37.4 |
+ 57.3 |
0.6 | 10.5 |
| Mexico |
404,873 |
+ 80.6 |
+ 258.8 |
0.6 | 4.3 |
| Norway |
401,889 |
+ 19.6 |
+ 26.1 |
0.6 | 91.3 |
| Denmark |
336,928 |
+ 17.3 |
+ 20.4 |
0.4 | 64.8 |
| Belgium |
320,840 |
+ 17.6 |
+ 93.4 |
0.4 | 31.5 |
| Switzerland |
306,073 |
+ 15.8 |
+ 36.4 |
0.4 | 41.9 |
| Korea |
283,459 |
+ 9.0 |
+ 52.1 |
0.4 | 6.2 |
| Austria |
274,173 |
+ 34.5 |
+ 91.5 |
0.4 | 33.4 |
| New Zealand |
271,003 |
+ 48.9 |
+ 97.5 |
0.4 | 75.3 |
| Russia |
236,526 |
+23.6 |
+ 41.8 |
0.3 | 1.6 |
| Poland |
158,099 |
+ 15.8 |
+ 45.6 |
0.2 | 4.7 |
| South Africa |
167,635 |
+ 19.3 |
+ 16.1 |
0.2 | 3.9 |
| Singapore |
148,249 |
+ 42.7 |
+ 121.1 |
0.2 | 43,6 |
| Argentina |
142,470 |
+ 39.9 |
+ 114.4 |
0.2 | 3.9 |
| Israel |
139,946 |
+ 22.6 |
+ 43.1 |
0.2 | 24.1 |
| Hong Kong |
114,882 |
+ 17.0 |
+ 38.7 |
0.2 | 18.5 |
| Hungary |
113,659 |
+ 21.3 |
+ 36.1 |
0.2 | 11.4 |
| Czech Republic |
112,748 |
+ 28.2 |
+ 52.8 |
0.2 | 11.1 |
| Turkey |
90,929 |
+ 77.3 |
+ 179.8 |
0.1 | 1.4 |
| Portugal |
90,757 |
+ 52.9 |
+ 82.5 |
0.1 | 7.4 |
| Greece |
77,954 |
+ 24.2 |
+ 51.2 |
0.1 | 7.4 |
| China (excl. HK) |
71,769 |
+ 14.0 |
+ 304.9 |
0.1 | 0.06 |
| Ireland |
59,681 |
+ 2.2 |
+ 8.8 |
0.1 | 16.6 |
| Malaysia |
59,021 |
+ 10.4 |
+ 23.3 |
0.1 | 2.8 |
| Total |
72.398.092 |
+ 28,8 |
+ 67,5 |
| 3,4 * |
| *
The worldwide density index is based on the total hostcount excluding the United States. |
There is faster growth in the United States than in Europe and in the rest of the world. There is a remarkable acceleration in some parts of Latin America. European data, reported in part 6 of this issue, indicate an even greater change in France. China has much faster growth than in past years, but still low density in relation to its vast population.
This is the picture by broad geographic areas.
Geographic areas
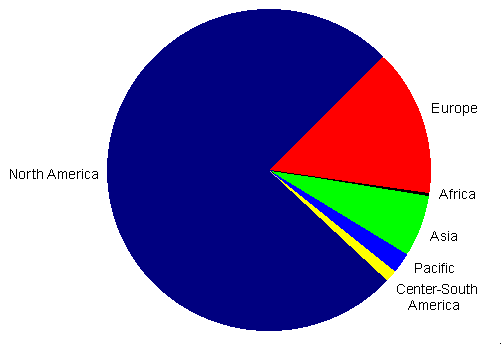
In this graph, as in all those following, data have been adjusted in consideration of the fact
that some .com .org .net domains are based outside the Unites States.
In any case this factor has a realitively small impact on the overall picture.
There are no major changes compared to past years. A very large part of the world is still isolated from the net. In each of the areas there is concentration. 96 percent of the internet in North America is in the US. Almost all of the Pacific is in Australia and New Zealand. Japan's share of Asia is decreasing, but it's still 61 percent of the total. 90 percent of Africa in South Africa, 78 percent of South America in Brazil and Argentina. In Europe no country has more than 17 percent, but there are considerable differences in the development of individual countries.
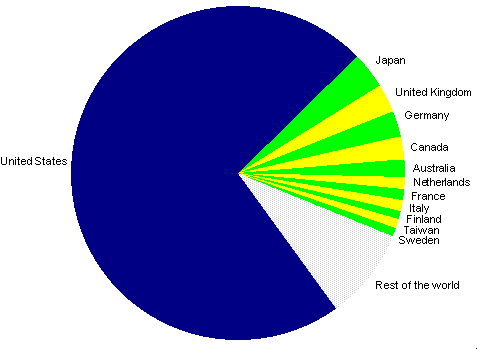
The dominant position of the United States is obvious in this graph (countries with over 500,000 internet hosts).
12 countries
If we exclude the United States, this is the picture for the other 18 countries with over 300,000 internet hosts.
18 countries
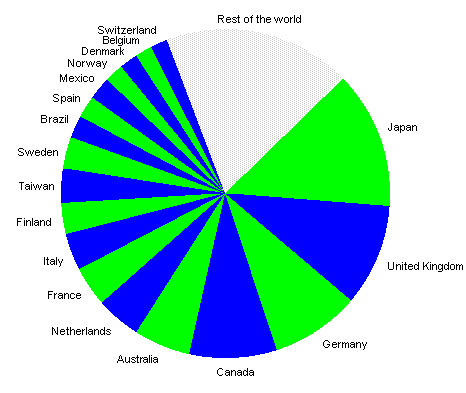
There are some relevant changes compared to past years – such as the growth in France, Italy, Spain, Brazil and Mexico. But almost half of the net outside the United States is still concentrated in five countries: Japan, the United Kingdom, Germany, Canada and Australia.
Now let's look at an update of the graph that shows density in relation to population in the 31 countries that have more than 100,000 internet hosts.
Internet hosts per 1000 inhabitants in 31 countries

Once again, we see the United States leading also in density (Finland was overtaken in 1998). Here is an update of density as a world map.
Internet hosts per 1000 inhabitants
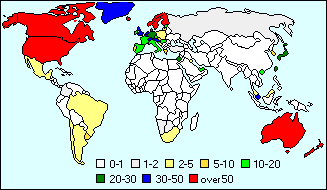
The general picture hasn't changed. The net is still concentrated mostly on the two sides of the North Atlantic, with isolated spots of density in Asia, the Pacific and the Middle East. We see the beginning of a change in Latin America and some development in the southern tip of Africa. Penetration in the rest of the world is still very low.
Here is an update of the situation in relation to income (GNP).
Internet hosts in relation to income (GNP) in 31
countries

Some of the differences, compared to analyses in the past, are due to the use of a different criterion for the definition of GNP. But there are also some real changes, including an improvement in some of the weaker countries, such as France and Italy. Japan and Germany still have relatively low internet activities compared to the general strength of their economies.
back to top
|
 |
6. Numbers in Europe |
|
|
It's been two months since we last looked at European. There can't be radical changes in such a short time. But there are some interesting developments.
Let's start with the graph that compare growth in Europe and worldwide.
Growth index of the number of internet hosts
January 1995=100
Six-monthly data (January and July of each year)
Analysis on data by the Internet Software Consortium and RIPE
(Réseaux IP Européens)

For several years growth in Europe was the same as in the rest of the world. Now the picture seems to be changing, even faster in the second half of 1999 than in the first. This seems to be due more to an increased concentration in North America than to the growth in some other areas (such as South America and parts of Asia).
Now let's look at hoscount statistics for Europe as reported by RIPE on February 21 2000. There are now 14 countries in Europe with over 200,000 internet hosts. Here are the data, compared to those for the same period in 1998 and 1999.
| |
1998 |
1999 |
2000 |
| United Kingdom |
1,058,247 |
1,467,550 |
1,741,727 |
| Germany |
1,140,066 |
1,479,027 |
1,640,343 |
| France |
385,443 |
623,500 |
1,264,027 |
| Netherlands |
401,206 |
640,625 |
1,020,960 |
| Italy |
282,052 |
413,882 |
733,108 |
| Spain |
201,685 |
308,437 |
539,113 |
| Sweden |
360,643 |
417,894 |
524,081 |
| Finland |
501,211 |
470,887 |
492,513 |
| Norway |
295,115 |
319,628 |
442,510 |
| Denmark |
172,531 |
301,242 |
354,434 |
| Belgium |
111,883 |
216,690 |
339,357 |
| Switzerland |
192,183 |
249,630 |
300,249 |
| Austria |
110,518 |
172,569 |
262,632 |
| Russia |
152,021 |
195,183 |
240,752 |
| Total area |
5,942,491 |
8,200,734 |
10,816,526 |
There are now four countries in Europe with over a million internet hosts. Strong development continues in the Netherlands; in France we are seeing the results of online activity moving from the minitel to the internet. Italy and Spain are now ahead (in total numbers) of traditional leaders such as Finland, Sweden and Norway.
The picture is more immediately obvious if we look at it as a "pie" graph.
14 countries
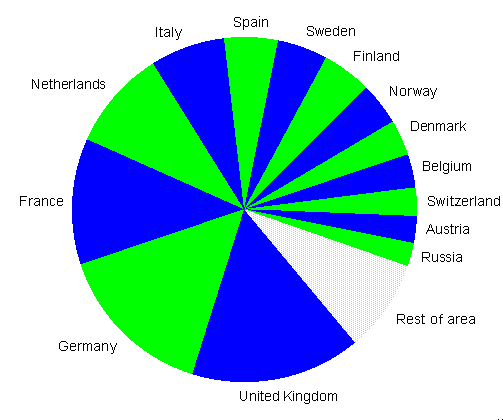
Over half of the internet in Europe is in four countries.
The next table shows a more detailed analysis (33 countries – of 100 in the RIPE area – with over 10,000 hosts).
| |
Number of hosts
2000 (adjusted) |
% growth
in a year |
% of
total area |
hosts per
1000 inhab. |
| Iceland |
33,828 |
+ 34.5 |
0.3 |
123.5 |
| Norway |
442,510 |
+ 38.4 |
4.1 |
100.6 |
| Finland |
492,513 |
+ 4.6 |
4.6 |
96.6 |
| Denmark |
354,434 |
+ 17.7 |
3.3 |
68.2 |
| Netherlands |
1,020,960 |
+ 59.4 |
9.4 |
65.0 |
| Sweden |
524,081 |
+ 25.6 |
4.8 |
59.6 |
| Switzerland |
300,249 |
+ 20.3 |
2.8 |
41.1 |
| Belgium |
339,357 |
+ 56.6 |
3.1 |
33.3 |
| Austria |
262-632 |
+ 52.2 |
2.4 |
32.0 |
| United Kingdom |
1,741,727 |
+ 18.7 |
16.1 |
29.9 |
| Ireland |
100,034 |
+ 68.6 |
0.9 |
27.8 |
| Israel |
155,038 |
+32.5 |
0.9 |
26.7 |
| France |
1,264,027 |
+ 102.7 |
11.7 |
21.6 |
| Estonia |
30,661 |
+ 24.7 |
0.3 |
20.4 |
| Germany |
1,640,343 |
+ 10,9 |
15.2 |
20.0 |
| Spain |
539,113 |
+ 74.8 |
5.0 |
13.6 |
| Italy |
733,108 |
+ 77.1 |
6.8 |
12.8 |
| Slovenia |
23,559 |
+ 2.6 |
0.2 |
12.3 |
| Czech Republic |
124,077 |
+ 40.9 |
1.1 |
12.2 |
| Hungary |
119,642 |
+ 20.5 |
1.1 |
12.0 |
| Portugal |
81,046 |
+ 37.5 |
0.7 |
8.3 |
| Greece |
79,642 |
+ 50.0 |
0.7 |
7.6 |
| Latvia |
18.877 |
+ 25.7 |
0.2 |
7.6 |
| Slovakia |
28.680 |
+ 24.3 |
0.3 |
5.3 |
| Poland |
181.784 |
+ 55.3 |
1.7 |
4.7 |
| Lithuania |
14.571 |
+ 43.3 |
0.1 |
3.9 |
| Croatia |
16.130 |
+ 36.5 |
0.1 |
3.6 |
| Bulgaria |
17,199 |
+ 63.2 |
0.2 |
2.1 |
| Russia |
240,752 |
+ 63.2 |
2.2 |
1.6 |
| Romania |
36.294 |
+ 37.7 |
0.3 |
1.6 |
| Turkey |
85,700 |
+ 75.4 |
0.8 |
1.4 |
| Ukraine |
28,973 |
+ 36.2 |
0.3 |
0.6 |
| European Union |
9,184,403 |
+ 37.3 |
84.9 |
24.6 |
| Total area |
10,818,526 |
+ 31.9 |
|
15.4 |
85 percent of the internet in the Europe – Mediterranean – Middle East area (that also includes part of north and central Africa) is in the European Union. Three quarters of the total are in ten of a hundred countries: the United Kingdom, Germany, France, Benelux and Scandinavia. Four Mediterranean countries (Italy, Spain, Greece, Turkey) had fast growth in 1999; but they are still far behind the density in northern Europe.
Now let's look at the usual graphs on a European scale, starting with density, in the 28 countries (of 100 in the RIPE area) with over 20,000 internet hosts
Internet hosts per 1000 inhabitants in 28 countries
in the Europe-Mediterranean area
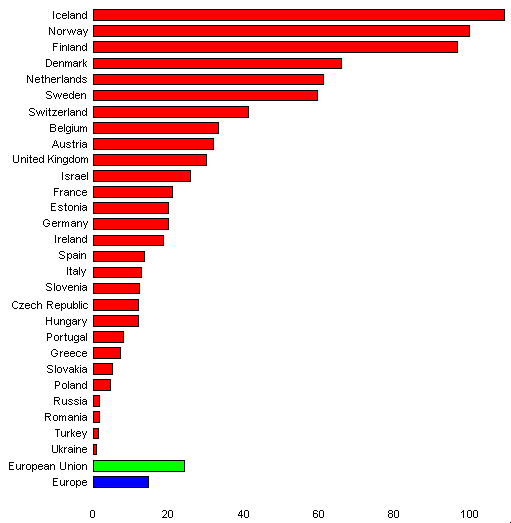
We no longer see a separation between Finland and other advanced countries; there is high density in all of the Scandinavian area. There is continuing growth in the Benelux (especially in the Netherlands). Britain is increasing its lead among the "large" countries and France is gaining considerably. Southern European countries are improving, but they remain below the average in the European Union.
Here is the European density picture seen as a map.
Internet hosts per 1000 inhabitants in Europe
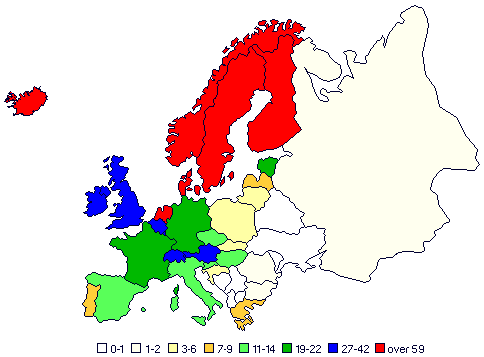
No major variations compared to recent data (but considerable change since the first map we saw in October 1998). Ireland was somewhat underestimated for a while in hostcount data; a more realistic update shows a density level close to the UK.
The following graph is an update of the other usual analysis, internet activity in relation to income (GNP).
Internet hosts in relation to income (GNP)
in 28 countries
in the Europe-Mediterranean area
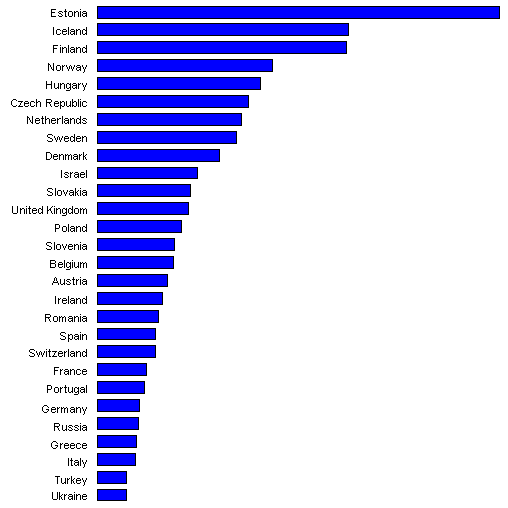
As in the case of the worldwide data, criteria for GNP definition are different from those used in the past. But there are also actual changes, such as increasing strength in the Netherlands and in the United Kingdom.
Strong trends continue over extended periods of time, even in a fast-changing and turbulent environment such as the internet. But there are changes. Differences across Europe are still very large, but western Europe is gradually coming together and some eastern European countries are remarkably strong in internet activity in relation to their economy.
|
|