Roberto Vacca
Web Site

1976 Discontinuity in atmospheric CO2 and curve fitting on 1959-76 & 1976-2003 data
by Roberto VACCA, Rome, Italy, October 13, 2004
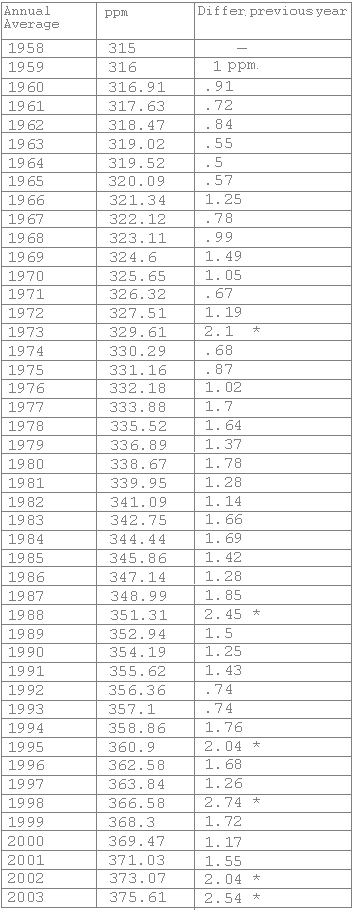
The table gives averages of atmospheric CO2 concentration in MaunaLoa, measured by C.D.Keeling & T.P. Whorf ( Scripps Instit. of Oceanography of Univ.of California)
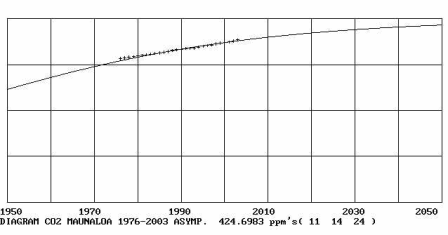
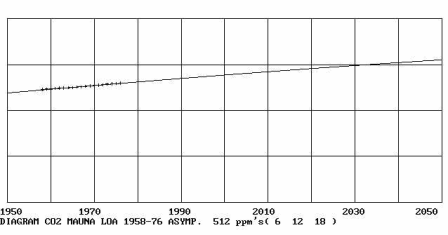
In the last 4 decades atmospheric CO2 concentration increased: a clear discontinuity took place in 1976. The average increase between 1959 and 1976 was of .95 ppm/year, whereas between 1976 and 2003 it was of 1.608 ppm/year. This increase in the slope of CO2 concentration is construed by some as a sign that said concentration is now aiming (faster) at ultimate higher levels. The forecast, however, is based on naive extrapolation procedures. I have fitted to the two time series 1959-76 and 1976-2003 a three variable logistic Volterra equation of the form;

since often similar relationships were found to describe accurately growth processes of variables expanding to fill an ecological niche. The table gives the results obtained.

This indicates that from 1976 the atmospheric CO2 concentration is increasing faster than in previous years towards the lower asymptote of 424 ppm which should be reached in the first decades of the 22nd century (see diagram).
The time constant is the time to go from 10% to 90% of the final asymptote. Values of constants B and C were determined using a standardized time scale in which the time for the year 1950 is 1.5 and the time for the year 2050 is 2.5.
The D-factor is an indicator of the unicity of the equation (see Franchina, V., Vacca, R. - Logistic Curves: Construction and Unicity , International Conference on the Diffusion of Technologies and Social Behavior, IAASA, 1989). D-factor values much lower than 10-4 indicate that data don't aim to a sharply defined asymptote, but admit a wide range of plausible asymptotes, all featuring low values of the standard error in the fit.
The 2 very low standard errors in the equations' fits and the high values of the D-factor (particularly for the 1976-2003 series) indicate that the analysis is credible. If future observations confirm the current trend aims at the 424 ppm asymptote (13% higher than the 2003 level), dangers of global warming due to increases of atmospheric CO2 would be assessed as much lower than judged by some or, perhaps, as non existent.
In the third column of the table the difference is given between each year and the previous one. This exceeds 2 ppm in 1973, 1988, 1995, 1998, 2002 and 2003. It has been suggested that this indicates a further increase of the rate. Whether this is so will appear in the next few years. A correlation with the ENSO (El Niño Southern Oscillation) appears unlikely since strong El Niño phenomena appeared in 1973, 1983, 1993 and 1998 -- so: only in 2 years (but not in 4 others) there was an increase of more than 2 ppm AND strong ENSO.