In addition to the graph in The stupidity of power there are a few other possible hypotheses – that can be analyzed using the Cartesian coordinates.
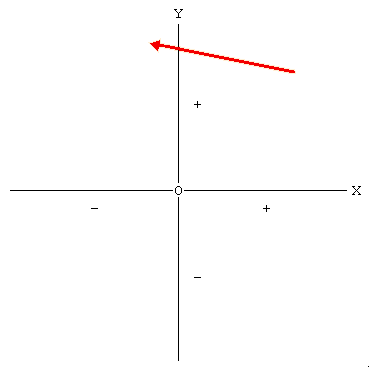
Let’s assume, for instance, a situation in which “intelligent power” prevails. We would probably see a trend like this.
Let’s remember that the “first quadrant” (top right)
is the “inteligence area“, while in the “second” (top left)
we find people who do good for others, but not for themselves.
The more someone’ behavior benefits others,
the higher it is placed on the “Y-axis”.Power, in this case, deliberately chooses to offer greater advantages to the community than to itself, to the point – sometimes – of accepting some disadvantages if they help to improve general wellbeing (as already noted, in this case people in power can not be defined as “hapless” or “helpless”.)
The shift to the upper part of the “Y-axis” is unlikely to be fast, but it tends to be steady and consistent. Such situations are not impossible. There are nearly always a few in some parts of the system. But they depend on unusually well tuned, well motivated teamwork – harmonies that aren’t easily generated or reproduced, and can fall apart because of changes in the environment or disruptions in their structure.
Rare as they are, such teams are extraordinarily effective. The observation of history and facts confirms that real innovations and improvements in society are much more likely when there are synergetic teams, active symbiosis, instinctive cohesion and strong humanity.
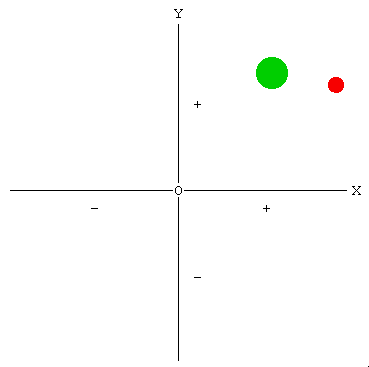
When such behaviors prevail, the result is a situation like the one shown in the next graph (where the red area marks the position of people in power, the green is the rest of the community.)
Here we find all results placed in the intelligence area,
with people in power gaining greater
advantage for themselves (+ in the “X-axis”).There are no “arrows” in this graph because, in the most favorable circumstances, such a system can remain stable (or make slow progress, as indicated in the first graph.) In a stabilized situation people in power are likely to have greater advantages than the rest, but as this works for everyone’s benefit it isn’t a problem – as long as two (opposed but synergetic) stupidity factors don’t get into the picture: servility and envy.
I don’t want to complicate the picture, but I think there is one relevant comment. In some particularly efficient organizations the two areas overlap, because there is no hierarchy and responsibilities are shared. It’a a well known fact that this is the most “intelligent” form of human cooperation and it can produce extraordinary results.
Such systems are basically strong, but they are exposed to damage. They can be warped by internal problems, such as stupidity factors or power syndromes. Or they can suffer from changes in the environment – or be disrupted by intervention from the outside which (deliberately or by mistake) upsets their delicate balance.
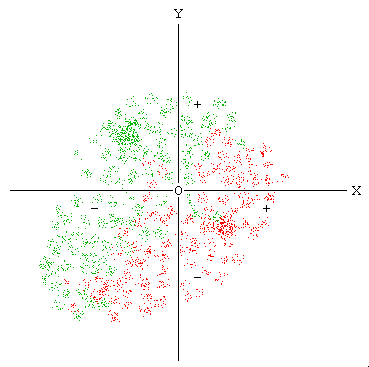
After this short digression on intelligence we must go back to the unfortunately overwhelming subject – stupidity. Let’s take another look at history. We find that at times of decline and fall the percentage of stupid people remains a constant, but there is, especially among people in power, a higher concentration of “bandits”, who often tend to become stupid when the result of their behavior is evaluated considering the unbalance created by their role. While among people who are not in power there are more of those who, in this case, can be correctly called “helpless”. One if the consequences is that the destructive power of stupidity is increased – and the resulting situation goes from bad to worse.
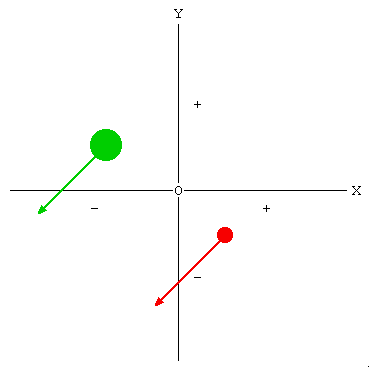
In this case the position of people in power, and of the rest of the people, is placed as we see in the next graph.
Here all degrade moving into the “third quadrant”,
that is the area of stupidity.
It’s hard to understand, in this type of situation, if the stupidity of power generates widespread stupidity – or vice versa. In most cases both contribute to a “vicious circle” and so the entire system deteriorates, as shown by the arrows in the graph.
Sometimes this trend can be reversed, but that requires a very special combination: the convergence of intelligent people that can gain power and a strong collective thrust for substantial change.
In the absence of such an “intelligent mutation”, or of an outside influence that changes the basic criteria, over time the system tends to explode – that is, to disintegrate.
If a “chaotic” situation occurs before there is irreparable damage to the entire ecosystem... almost anything can happen. A turbulent vortex generates countless openings for stupidity, but “intelligent” developments are not totally impossible. (Some comments on this subject are in Simple thoughts on complexity.)
Some readers tell me that they feel uncomfortable with the use of the coordinates. That’s no problem. Concepts can be understood without getting into the details of the graphs. Quite to the contrary, other readers find these graphs particularly interesting – and would like to see more. But what I am trying to do here is just to set a pattern, not to explore the potentially infinite variety of specific analyses.
As I said at the beginning – in these comments I am deliberately staying away from any specific application of the general concepts. But we can all experiment as we wish on all sorts of practical situations (from the general state of the planet to large or small communities.) By simply drawing two crossing lines on a piece of paper we can make as many blank “Cartesian coordinates” as we wish – and fill them in by placing individuals, or groups of people, in the appropriate places. It’s not necessary to use a computer spreadsheet, but of course (is someone so wishes) that’s just another way of doing the same thing.


