No. 70 – February 25, 2004 |
Other articles on similar subjects
are published in English
in the Offline column
|
 |
1. Continuing growth of the internet |
|
|
Of course we should never forget that there is no
“certainty” in data and statistics. They are never
totally accurate and they cam be misleading. However
hostcount data have proven, over the years, to be an
effective tool in understanding the growth and evolution of
the internet.
As regular readers know, in the last four years the basic
analyses are no longer in this newsletter. They are in the
data section of this site. But,
as was done in previous periods (see, for instance, issues
62 – February 2002 –
and 68 – April 2003)
I am placing here a few of the key data, which
will remain as “historical reference” when the
documents in the data section will be updated.
The Internet Domain Survey,
that for fifteen years was published every six months, did not appear
for the first half of 2003. On February 10, 2004, data became available
for year end 2003. While in 2002 growth appeared to be slower,
now it seems to be more in line with previous years. We don’t
know (but that isn’t particularly relevant) if there was a
real change in speed or 2002 figures were somewhat
“underestimated”. Trends always need to be
understood over relatively long periods – more than one, or
even two or three years.
One fact is clear: the internet is continuing to grow –
and quite fast. The number of hosts increased 58 percent in
two years worldwide, 51 percent in Europe. The exaggerated
projections that were widely accepted ten or five years ago
were never matched by facts. On the other hand, the dismal
views that prevailed after the deflating of the financial bubble
were equally unrelated to the actual growth of online activity.
It’s unwise to attempt any projection or forecast.
But there is obvious potential for further growth, with no
“threshold” in sight at this stage of development.
back to top
|
 |
2. New worldwide data |
|
|
The analysis of international data
shows that, with some slower or faster phases, there is strong growth
of the internet worldwide. These are the numbers from 1994 to 2003.
| |
Number
of hosts |
yearly
growth |
| 1994 |
5,800,000 |
+ 119 % |
| 1995 |
12,900,000 |
+ 104 % |
| 1996 |
21,800,000 |
+ 104 % |
| 1997 |
28,700,000 |
+ 52 % |
| 1998 |
42,200,000 |
+ 46 % |
| 1999 |
72,400,000 |
+ 68 % |
| 2000 |
109,600,000 |
+ 51 % |
| 2001 |
147,300,000 |
+ 35 % |
| 2002 |
171,600,000 |
+ 17 % |
| 2003 |
233,100,000 |
+ 26 % |
It’s obvious that, with larger numbers, growth percentages
decrease. But there are changes in speed that don’t follow any
coherent pattern. Overall growth of the internet is the combination
of many separate and partly unrelated factors.
The situation remains almost unchanged in the broad picture
by large geographical areas.
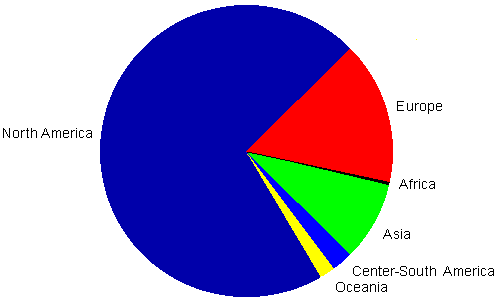
There are some changes compared to two or three years ago.
Asia has been growing a bit faster that Europe, central-south America
has overtaken the Pacific area. But these are small variations compared
to the overall picture.
In 1999 there were six contries worldwide with over a million internet
hosts (two in Europe). In year 2000 they were ten (four in Europe).
In 2001 thirteen (six in Europe). In 2002 seventeen (nine in Europe).
In 2003 twenty – thirteen in Europe, four in the Americas, two
in Asia and one in Oceania.
The countries with over two million hosts were two in 1999,
five in 2000, eight in 2001, eleven in 2002 and 2003 (five in Europe).
With over three million hosts they were two in 2001, eight in 2003
(four in Europe).
The next chart shows figures for the 35 countries (of 240) with over
200,000 internet hosts.
| |
Number of hosts
December 2003 |
% growth
in a year |
% of
total |
Per 1000
inhabit. |
| United States |
147,116,789 |
+ 40.2 |
63.2 |
522.8 |
| Japan |
12,962,065 |
+ 40.0 |
5.6 |
102.1 |
| Italy |
5,469,578 |
+ 41.5 |
2.4 |
97.1 |
| United Kingdom |
3,715,752 |
+ 26.5 |
1.6 |
62.2 |
| Germany |
3,421,455 |
+ 17.0 |
1.5 |
41.6 |
| Netherlands |
3,419,182 |
+ 8.6 |
1.5 |
215.5 |
| Canada |
3,210,081 |
+ 2.6 |
1.4 |
106.1 |
| Brazil |
3,163,349 |
+ 41.4 |
1.4 |
18.6 |
| Australia |
2,847,763 |
+ 11.1 |
1.2 |
167.8 |
| Taiwan |
2,777,085 |
+ 28.0 |
1.2 |
131.8 |
| France |
2,770,836 |
+ 28.4 |
1.2 |
47.4 |
| Spain |
1,694,601 |
n.a. |
0.7 |
41.4 |
| Sweden |
1,539,917 |
+ 27.3 |
0.7 |
173.4 |
| Denmark |
1,467,415 |
+ 27.2 |
0.6 |
274.3 |
| Belgium |
1,454,350 |
+ 38.2 |
0.6 |
142.0 |
| Mexico |
1,333,406 |
+ 20.4 |
0.6 |
13.7 |
| Poland |
1,296,766 |
+ 53.7 |
0.6 |
33.6 |
| Finland |
1,259,763 |
+ 3.3 |
0.5 |
242.5 |
| Switzerland |
1,018,445 |
+ 40.8 |
0.4 |
139.8 |
Norway |
1,013,273 |
+ 59.8 |
0.4 |
224.1 |
| Austria |
982,246 |
+ 17.2 |
0.4 |
109.6 |
| Russia |
800,277 |
n.a. |
0.3 |
5.5 |
| Argentina |
742,358 |
+ 46.1 |
0.3 |
20.6 |
| Israel |
634,001 |
+ 72.9 |
0.3 |
108.0 |
| Hong Kong |
591,993 |
+ 48.7 |
0.3 |
88.3 |
| Singapore |
484,825 |
+ 42.6 |
0.2 |
148.6 |
| South Korea |
475,834 |
n.a. |
0.2 |
10.5 |
| New Zealand |
474,395 |
+ 9.6 |
0.2 |
126.9 |
| Hungary |
365,221 |
+ 43.5 |
0.2 |
35.8 |
| Czech Republic |
362,083 |
n.a. |
0.2 |
35.2 |
| Turkey |
359,500 |
+ 63.1 |
0.1 |
5.7 |
| Portugal |
299,923 |
+ 2.9 |
0.1 |
29.0 |
| South Africa |
288,633 |
+ 16.8 |
0.1 |
6.7 |
| Greece |
245,650 |
+ 21.9 |
0.1 |
23.9 |
| Chile |
202,429 |
+ 49.8 |
0.1 |
13.1 |
| Total |
233.101.491 |
+ 35,8 |
|
14,8 |
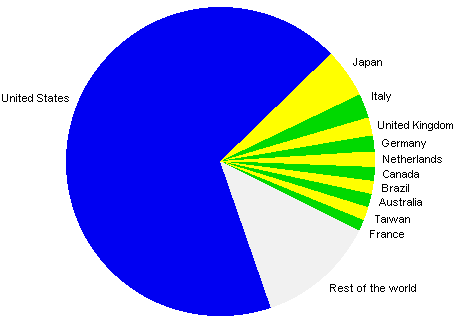
This “pie” graph shows the situation, at the end of
year 2003, for the eleven countries with over two million internet hosts.
Internet hosts
in 11 countries
countries worldwide with over
two million hosts
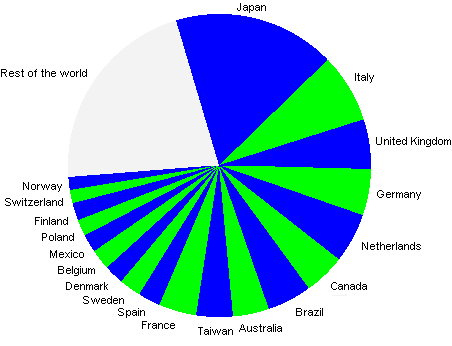
Excluding the United Sttes, this is the picture for the other
19 countries with over a million internet hosts.
Internet hosts
in 19 countries
countries worldwide
with over a million hosts (US
excluded)
The next graph shows density (hosts per 1000 inhabitants) for the 24 countries
(excluding the United States) with over 500,000 internet hosts.
Internet
hosts per 1000 inhabitants in 24
countries

And this is the situation seen as a world map.
Internet hosts
per 1000 inhabitants
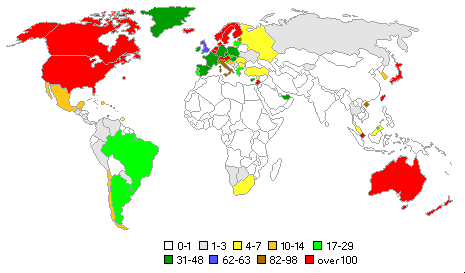
In addition to the map of Europe, that appears also in
point 3 of this issue,
in another
analysis there are similar maps
of Asia and Latin Anerica.
This is the situation in relation to income (gross national product)
in the 24 countries (excluding the US) with over 500,000 internet hosts.
Internet
hosts in relation to income (GNP)
in 24 countries

More detailed analyses, with comments onthe evolution, are in
the inhternational data document.
Another analysis available on this site explains the growing presence
in the internet of two language
communities (Spanish and Chinese). In that context there is an
approximate evaluation of the nine most active languages in the net.
Most
active languages in the
internet
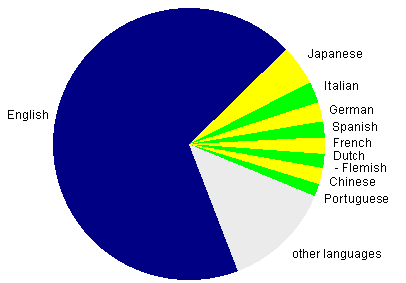
English is obviously doiminant, but eight other languages
have a relevant presence online. Over time, Spanish is likely to
become the second largest language in the internet (it’s already
in that possition if we consider the number of countries in which it is
spoken.) Chinese would have a larger presence than Japanese
if restricrions were lifted in mainland China.
A new analysis of the international situation will probably
be available in the first quarter of 2005.
back to top
|
 |
3. New European data |
|
|
There are some relevant shanges in Europe compared to the situation
that was summarized in issue 68 (April 2003).
As usual, a more detailed analysis is in the
European data document.
It’s quite surprising that hostcount data show Italy as
the leading country in Europe. It’s safer to think that it
may be in third place, after the UK and Germany. But the continuity
of the development in the last three years shows that this isn’t
just a fluke. In any case, trends need to be reviewed over time and
it takes more than a few years to understand their meaning.
The total European hostcount is getting close to 34 million.
If the current trend continues, it will be approximately 40 million
by the end of 2004. This is an update of the situation in the 25
European countries with over 100,000 internet hosts.
| |
Number of hosts
December 2003 |
% of
Europe |
Per 1000
inhabit. |
| Italy |
5,460,578 |
16.2 |
97.1 |
| United Kingdom |
3,715,752 |
11.0 |
62.2 |
| Germany |
3,421,455 |
10.2 |
41.6 |
| Netherlands |
3,364,044 |
10.0 |
215.5 |
| France |
2,770,836 |
8.2 |
47.4 |
| Spain |
1,694,601 |
5.0 |
41.4 |
| Sweden |
1,539,917 |
4.6 |
173.4 |
| Denmark |
1,467,415 |
4.4 |
274.3 |
| Belgium |
1,454,350 |
4.3 |
142.0 |
| Poland |
1,296,766 |
3.8 |
33.6 |
| Finland |
1,259,763 |
3.7 |
242.5 |
| Switzerland |
1,018,445 |
3.0 |
139.8 |
| Norway |
1,013,273 |
3.0 |
224.1 |
| Austria |
982,246 |
2.9 |
109.6 |
| Russia |
800,277 |
2.4 |
5.5 |
| Hungary |
365,221 |
1.1 |
35.8 |
| Czech Republic |
362,083 |
1.1 |
35.2 |
Portugal |
299,923 |
0.89 |
29.0 |
| Greece |
245,650 |
0.73 |
23.9 |
| Ireland |
155,467 |
0.46 |
42.9 |
| Romania |
141,202 |
0.42 |
6.3 |
| Ukraine |
130,569 |
0.39 |
2.6 |
| Estonia |
113,154 |
0.34 |
82.8 |
| Slovakia |
111,188 |
0.33 |
20.7 |
| Iceland |
106,296 |
0.32 |
381.4 |
| European Union |
27,024,000 |
82.9 |
74.8 |
| Europe |
33,708,000 |
|
48.0 |
When ten more countries join the European Union, the EU share of
the total European hostcount will grow from 83 to 90 percent.
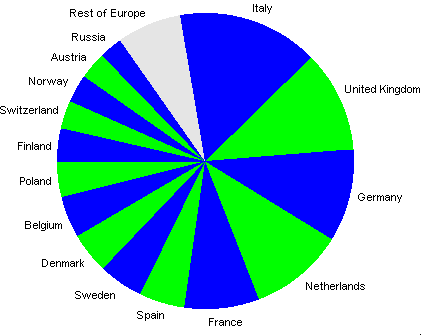
This “pie” graph shows the situation, at the end of
year 2003, for the 15 European countries with over 500,000 internet hosts.
Internet hosts in 15
European countries
countries
with over 500,000 hosts
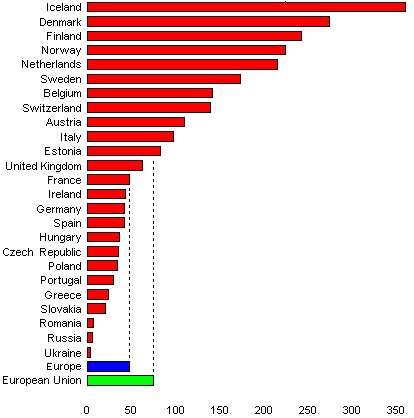
The next graph shows density (hosts per 1000 inhabitants)
in the 25 European countries with over 100,000 internet hosts.
Internet hosts per 1000
inhabitants
in 25 European countries
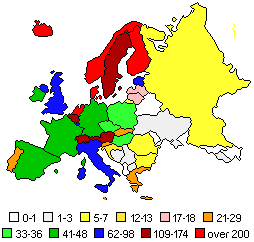
And this is density seen as a map of Europe.
Internet hosts per 1000
inhabitants
This the situation in relation to income (gross national product)
in the 25 European countries with over 100,000 internet hosts.
Internet hosts
relation to income (PNL)
in 25 European countries

The situation continues to evolve, but some “traditional”
facts remain, such as the strong internet activity in Finland. There is
relevant growth in several Eastern European countries.
The Netherlands had considerable growth in recent years, while
some of the largest countries in Western Europe don’t have
a presence online in proportion to the strength of their economies.
back to top
|
 |
4. People online in Italy |
|
|
Statistics on the number of people using the internet
aren’t very reliable. But some historical sequences
are reasonably choherent and relevant.
These two graphs are only a short summary of a much
more extensive analysis of who
uses the internet in Italy
The first graph shows evolution from 1997 to 2003.
Internet
“users” in Italy
1997-2003
numbers
in thousands

Growth was fast until year 2000, then slower, but it appears to be improving in
the second half of 2003. From the beginning to 1999 internet use was predominatly
in the workplace, but home use has been expanding in the last four years.
The second graph is based on relatively frequent use of the net (“at least
once a week”) and shows changes from January 2001 to January 2004.
Internet
“users” in Italy
January
2001 – January 2004
numbers
in thousands

There are ups-and-downs (not always related to sesonal factors) and
the expansion of internet use isn’t as fast a some naive projections
suggested a few years ago. But it’s continuing to grow in Italy
– as in most of Europe. There is condiserable potential for additional
growth, depending mostly on cultural evolution and on improvements in
the quality of content and services offered online.
|
|