No. 62 – February 27, 2001 |
Other articles on similar subjects
are published in English
in the monthly Offline column
|
 |
1. Editorial: The world is changing
– but only in some parts |
|
|
This issue of Netmarketing is about data and statistics
(with a short summary of the analyses that are in the
data section.) As always,
sources aren’t accurate and no numbers are
“certain.” However, after several years of working
with statistics and observing how they evolve, I think some
trends are relevant and worth watching.
The internet continues to grow. Not “exponentially”,
with ups-and-downs, but overall quite consistently – and
pretty fast. Many things can and will change, sometimes unexpectedly.
But there is a clear growth pattern that has been clearly visible
for at least twenty years.
We can divide the world, approximately, in three parts.
In the first, the internet has been well rooted for many
years – and growth continues. Of course it includes North
America and a substantial part of Europe – plus Australia,
New Zealand, Japan (and a few other countries in Asia.) There
are considerable changes, and there will be more; but they
occur in an environment where the internet isn’t
“new.” Though apparently ignored by many so-called
“experts”, there is a relevant heritage of relationships, communities, culture, that may have its “historical”
core in a relatively small number of people but has its own way
of growing and evolving regardless of political, social or
economic change – and regardless of technologies.
The second is “developing.” It includes those
countries (or parts of society in each country) where the
internet was unknown, or experienced only by a very small
number of people, until a relatively short while ago. In some
of these areas there is fast growth. As in parts of Latin
America and in a few places in Asia. The internet is growing
rapidly in these parts of the world, reaching levels that are
still far behind United States or Scandinavia but are getting
quite close to “European” levels.
The third, that unfortunately includes three fourths of
humanity, is almost completely excluded – and there are
scarce signs of evolution. There are four types of problems.
There are political restrictions. In many countries there
is hardly any freedom of information – and there is
especially harsh repression of the internet, that is either
prohibited or allowed only under strict control of the
authorities.
There are cultural blocks, not because of difficulties in
learning how to use the net (those can be overcome with some
good training and patience) but for a lack of openness and
willingness to understand diversity.
There are, of course, money problems. People in a state
of extreme poverty can’t afford the cost of connection or of
the necessary equipment. Many don’t even have a telephone –
or electricity. What makes things worse is that often
internet connections (and devices) are more expensive in
low-income places that in the “rich” countries.
And there are technical problems. Not because using the
net is difficult per se, but because the evolution of
technologies, aimed at those people who are more prone to
wasting money on unnecessarily expensive devices and useless
“innovations”, is grotesquely unfit for those
people who need reliable, stable, simple solutions –; and as
cheap as possible. Technologies are moving in the wrong
direction for all of us, but especially for the people who
need them most. Information and dialogue can’t, by
themselves, bring water to the thirsty, food to the starving,
medicine and care to the diseased, freedom to the oppressed.
But they are an essential tool for all effective solutions.
The trend needs to be reversed radically if information
technologies and communications are to be used as a key tool
for the solution of humanity’s biggest problems.
back to top
|
 |
2. New worldwide data |
|
|
Since November, 2000 the updates of internet data are no
longer in this newsletter but in a separate section on this
site. This is a short summary of some of the key findings in
the latest international data.
There were 147 million internet hosts worldwide in December,
2001. This was the evolution in the last ten years.
| |
Number
of hosts |
yearly
growth |
| 1994 |
5,846,000 |
+ 119 % |
| 1995 |
12,881,000 |
+ 120 % |
| 1996 |
21,819,000 |
+ 52 % |
| 1997 |
29,670,000 |
+ 36 % |
| 1998 |
43,230,000 |
+ 46 % |
| 1999 |
72,398,000 |
+ 67 % |
| 2000 |
109,574,000 |
+ 51 % |
| 2001 |
147,345,000 |
+ 35 % |
This was the situation, at the end of year 2001, in the
22 countries with over 500,000 internet hosts.
| |
Number of hosts
December 2001 |
% growth
in a year |
% of
total |
Per 1000
inhabit. |
| United States |
95,385,573 |
+ 29.5 |
64.7 |
342.6 |
| Japan |
7,188,333 |
+ 54.9 |
4.2 |
56.7 |
| Canada |
2,890,273 |
+ 22.3 |
2.0 |
92.9 |
| Germany |
2,681,325 |
+ 23.9 |
1.9 |
32.6 |
| Netherlands |
2,632,803 |
+ 62.2 |
1.8 |
166.6 |
| United Kingdom |
2,462,936 |
+ 7.5 |
1.7 |
41.9 |
| Australia |
2,288,584 |
+ 41.6 |
1.6 |
123.1 |
Italy |
2,284,457 |
+ 40.1 |
1.6 |
39.9 |
| Taiwan |
1,712,539 |
+ 56.3 |
1.2 |
78.2 |
| France |
1,670,649 |
+ 21.5 |
1.1 |
28.3 |
| Brazil |
1,644,575 |
+ 87.8 |
1,1 |
9.7 |
| Spain |
1,497,450 |
+ 125.7 |
1.0 |
37.8 |
| Sweden |
1,141,093 |
+ 49.4 |
0.8 |
128.2 |
| Finland |
944,670 |
+ 22.4 |
0.6 |
181.7 |
| Mexico |
918,288 |
+ 64.2 |
0.6 |
9.3 |
| Russia |
800,277 |
+ 145.1 |
0.5 |
5.5 |
| Denmark |
707,141 |
+ 62.4 |
0.5 |
133.4 |
| Belgium |
668,508 |
+ 60.3 |
0.5 |
65.5 |
| Austria |
657,173 |
+ 30.4 |
0.4 |
80.1 |
| Poland |
654,198 |
+ 75.9 |
0.4 |
16.9 |
| Norway |
629,669 |
+ 19.9 |
0.4 |
139.9 |
| Switzerland |
613,918 |
+ 33.0 |
0.4 |
83.0 |
| Total |
147,344,723 |
+ 34.5 |
|
9.0 * |
* The “worldwide” density average is calculated excluding the United States.
This is an update of the graph for the 13 countries with
over a million hosts.
Internet hosts in 13 countries
countries worldwide with over a million hosts
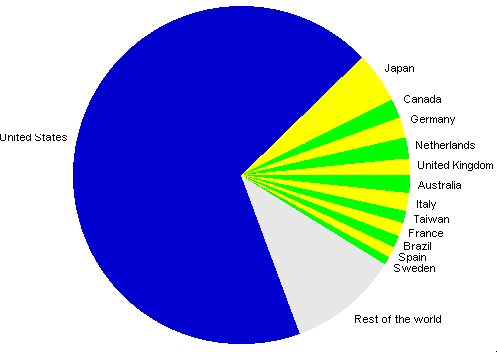
If, for better readability of the graph, we exclude the
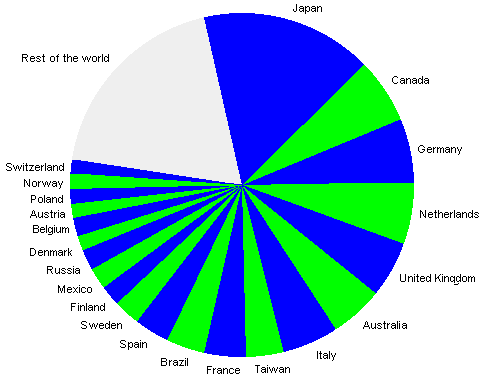
United States, this is the situation for the other 21
countries with over 500,000 hosts.
Internet hosts in 21 countries
countries worldwide with over 500,000 hosts (United States excluded)
There are strong differences in the speed of growth, as
shown by this chart (United States and Japan excluded for
better readability).
Internet hosts
Numbers in thousands

The red part of bars shows growth in two years (from 1999 to 2001)
Differences are even more obvious in the next chart,
where the stages of evolution are shown as percentages.
Internet hosts
Percentages

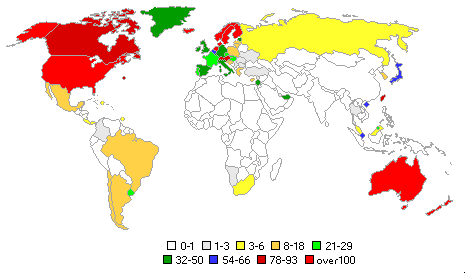
The next chart is an update on density (hosts per 100
inhabitants) in the 22 countries with over 500,000 hosts.
Internet hosts per 1000 inhabitants in 22 countries

The density picture is even more obvious if seen as a map.
Internet hosts per 1000 inhabitants
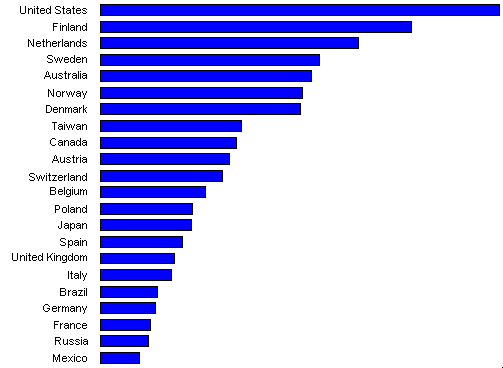
And this is the situation in relation to income, for the
same 22 countries as in the density graph.
Internet hosts in relation to income (GNP)
in 22 countries
For more details and comments see the section on
international data.
Another analysis leads to an approximate definition of
the most relevant languages in the internet.
Languages in the internet
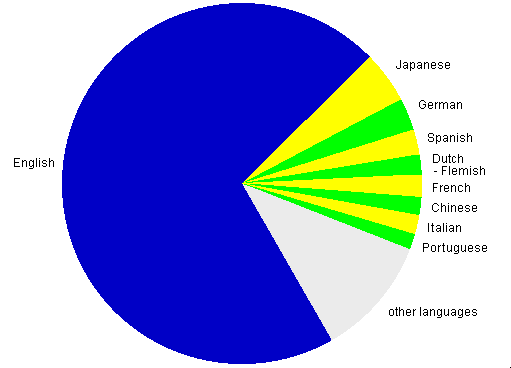
Of course English is dominant, but eight other languages have
a relevant role online. Trends indicate that Spanish is likely
to become the second international language in the internet
(expansion of the Chinese community online to its full
potential will take longer.) For more data and more
detailed comments see the section on
language communities.
Some other signs of evolution may be available in the
next few months, but a full-scale international update will
not be possible before July or August 2002.
back to top
|
 |
3. New European data |
|
|
A more detailed analysis is in the
European data section.
Here are a few highlights – updated to
December, 2001 (the first available statistics for year 2002
don’t show any relevant changes).
At the end of 2001 there were 22 million internet hosts
in Europe –; about 15 percent of the world total. With this
growth trend from 1990 to 2001.
1990 – 29,200
1991 – 129,700
1992 – 284,400
1993 – 553,400
1994 – 1,029,300
1995 – 2,206,400
1996 – 3,674,300
1997 – 5,790,000
1998 – 7,872,000
1999 – 10,268,000
2000 – 15,804,000
2001 – 22,332,000
This is the situation in the 19 European
countries with over 100,000 internet hosts.
| |
Number if hosts
December 2001 |
% change
in a year |
% of
Europe |
Per 1000
inhabit. |
| Germany |
2,681,325 |
+ 23.9 |
12.0 |
32.6 |
| Netherlands |
2,632,803 |
+ 62.2 |
11.8 |
166.6 |
| United Kingdom |
2,462,936 |
+ 5.9 |
11.0 |
41.9 |
| Italy |
2,284,457 |
+ 40.1 |
10.2 |
39.9 |
| France |
1,670,694 |
+ 21.5 |
7.5 |
28.3 |
| Spain |
1,497,450 |
+ 125.7 |
6.7 |
37.8 |
| Sweden |
1,141,093 |
+ 49.4 |
5.1 |
128.2 |
| Finland |
944,670 |
+ 22.4 |
4.2 |
181.7 |
| Russia |
800,277 |
+ 139.3 |
3.6 |
5.5 |
| Denmark |
707,141 |
+ 62.4 |
3.2 |
133.4 |
| Belgium |
668,508 |
+ 41.8 |
3.0 |
65.5 |
| Austria |
657,173 |
+ 30.4 |
2.9 |
80.1 |
| Poland |
654,198 |
+ 75.9 |
2.5 |
16.9 |
| Norway |
629,669 |
+ 19.9 |
2.8 |
139.9 |
| Switzerland |
613,918 |
+ 33.0 |
2.8 |
83.0 |
Portugal |
263,821 |
+ 48.4 |
1.2 |
26.7 |
| Czech Republic |
215,525 |
+ 33.6 |
1.0 |
21.1 |
| Greece |
182,812 |
+ 23.0 |
0.8 |
17.3 |
| Ireland |
128,092 |
+ | | |