In 2004 there was one contry with twenty million internet hosts:
the United States. Now there are six with over 25 million. (See
wordlwide data.) But they are nine if we
consider as “nations” the Spanish-speaking community and the
Chinese ethnic environment – and since 2009 also Portuguese.
The Spanish-speaking area includes 500 million people (nine tenths
of which are in the American continent.) They don’t speak
“identical” languages but they understand each other and share
culture and knowledge. This is, after English, the second largest language
community in the “western” world.
With 59 million internet hosts, the Spanish-speaking “nation”
is the third largest by hostcount, after the United States and Japan. (If
we include Portuguese, the total is 86 million hosts, second only to the US.)
This graph summarizes the growth of internet activity in the Spanish
and Portuguese areas in twelve years.
Internet hosts
– 1999-2010
millions
of hosts
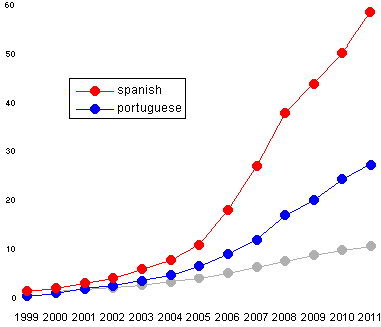
The
gray line is an index of worldwide percentage growth
In recent years there has been fast growth of the internet
in Spanish-speaking areas and especially in some Latin American
countries. The situation is summarized in this chart, from two
points of view: Latin America (including Brazil) and Spanish
language (including Spain.)
There are 21 countries in these areas with over a thousand
internet hosts.
| |
No. of hosts
December 2011 |
Per 1000
inhabit. |
| Brazil |
23,789,506 |
124.7 |
| Mexico |
15,165,150 |
135.0 |
| Argentina |
10,927,967 |
272.6 |
| Colombia |
4,281,046 |
94.1 |
| Chile |
1,853,927 |
108.5 |
| Uruguay |
945,826 |
281.8 |
| Venezuela |
888,028 |
30.3 |
| Dominican repub. |
404,057 |
43.1 |
| Guatemala |
346,834 |
23.6 |
Peru |
283,988 |
9.5 |
| Paraguay |
278,473 |
53.5 |
| Nicaragua |
178.278 |
30,6 |
| Bolivia |
167,123 |
16.1 |
| Ecuador |
162,281 |
11.3 |
| Costa Rica |
146,164 |
38.4 |
| Panama * |
120,000 |
35.2 |
| Honduras |
27.074 |
3,4 |
| El Salvador |
22,372 |
3.6 |
| Cuba |
3,664 |
0.3 |
| Latin America |
60,500,000 |
106.7 |
| Spain * |
17,000,000 |
364.8 |
| Andorra |
28,131 |
331.0 |
| Spanish language |
58,600,000 |
126.7 |
* Hostcount
figures for Spain and Panama appear understated at this time
and
therefore the number is arbitrarily, but not unreasonably,
increased.
The total for Spanish language includes an approximate
estimate
of the large “hispanic” communities in the United States.
As in all parts of the world, there are large differences, as is visible
in this chart (eight countries with over 400,000 internet hosts,
that have 98 percent of the total in Latin America.)
8 countries
in Latin America
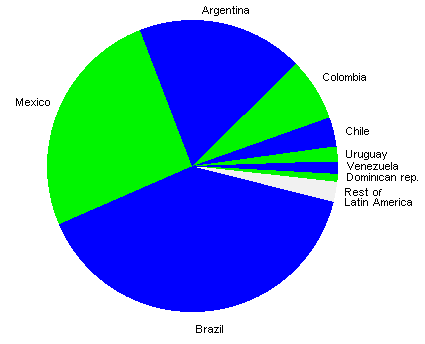
82 percent of the total is in three countries: Brazil, Mexico
and Argentina.
If we look at the same situation for the Spanish-speaking area, the picture
is different (of course Spain replaces Brazil.)
8
Spanish-speaking countries
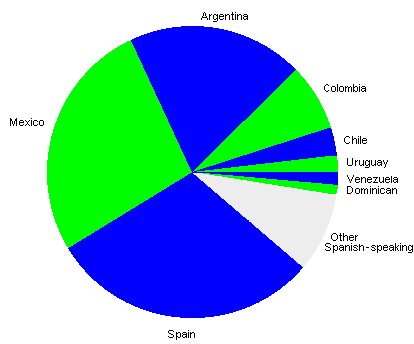
The size of the gray
“slice”, in addition to other Spanish-speaking countries,
includes
an approximate estimate of “hispanic” communities, especially in the US
If we “make room” for more countries by omitting
the first five, we see ten in Latin America with over 140,000
hosts (only three of which appear also in the previous graph.)
10 countries
in Latin America
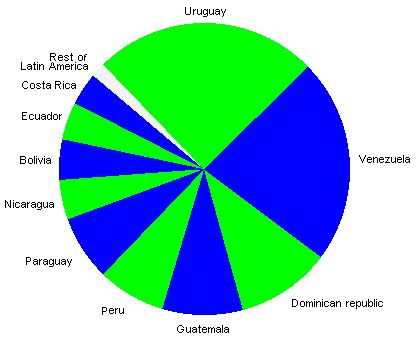
Let’s see now, as we do in the other data
analyses, density in relation to population. The graph includes (in addition
to Spain) eighteen countries with over 10,000 internet hosts, that have
99.9 percent of the total in Latin America .
Internet
hosts per 1000 inhabitants
in 18 Latin American
countries
(and Spain)
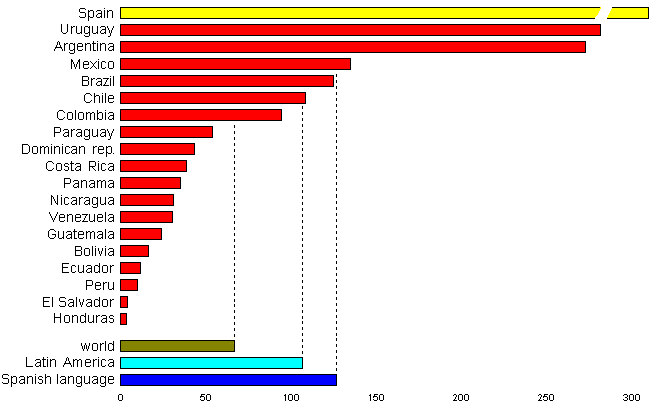
The size of Spain is reduced by 30 percent for graph readability.
In 2006, for the first time, density in Latin America became higher than
the world average. Since 2008 there are three countries in Latin America
(Uruguay, Argentina and Mexico) with over 100 internet hosts per 1000
inhabitants – with the addition of Brazil in 2010 and Chile in 2011
(Colombia, probably, in 2012.) Uruguay exceeded 200 per thousand in 2010
and Argentina in 2011.
This is the density picture in Latin America seen as a map.
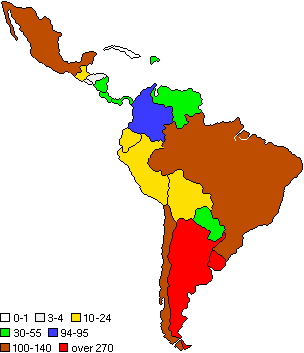
For a comparison of “geographic areas”, see
international data.
Growth continues, faster than world average. But (as in all other parts of the world)
there are large differences. We shall probaby see more changes in coming years.


